Determining Adequate Progress: Is what we are doing working?
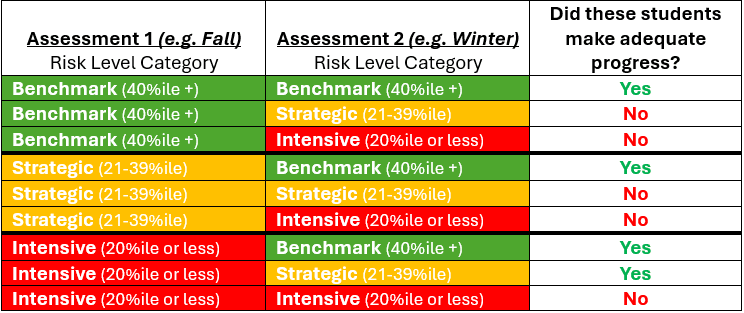
Academic growth is an expectation that we, as educators, have for all of our students, but just like our students, growth can come in many different shapes (measures) and sizes (amounts). Some of the major questions that educational systems try to address using growth data are Are the supports that your school provides helping ALL of your students to continue to grow and be on track for success and/or closing the gaps for the students who were behind? Who specifically is it and is it not working for? One high-level way of examining the effectiveness of your system is to look at the adequate progress (growth) that students are making between assessment periods. In its simplest sense, adequate progress represents students moving from a level of higher risk for poor academic outcomes to a lower level of risk (or remaining at low risk) of academic outcomes between assessment periods. In research related to multi-tiered systems of support (MTSS), some common thresholds have been established for determining at-risk levels and level of support needed for students (see table below):
NOTE: Student achievement assessments are just one medium for how to assess the overall health of your educational support system, not the only measure.

Using the thresholds from the table above, we have identified the scenarios below which would and would not constitute adequate progress.
The data above tells us the overall effectiveness of each of the Tiers in our system (those with green YES in column 3) and can also indicate where additional focus and strengthening of the system can occur. Although, the overarching goal is to have all students begin at benchmark and remain at benchmark throughout the grade (and their academic career), that simply is not the reality for most schools or students. Research on multi-tiered systems of support (MTSS) suggests that effective school systems should have 80%+ of students at Tier 1 (Benchmark) level of supports, as their resources will only be able to effectively support approximately 20% of students being in Tier 2 (Strategic) or Tier 3 (Intensive) supports. If your school is not at that level, do NOT panic. Typically, when schools are not meeting that 80% of students at benchmark guideline, it signifies that some improvements need to be made at the Tier 1 or core instructional level because too many students are falling through the cracks. More than likely, it means that your system may not be living up to some of the non-negotiables outlined in your model of instruction. Like the old saying goes, “a rising tide lifts all boats”, so if you focus on improving your model of instruction, it theoretically should improve the outcomes for all of your students.
So we should ONLY focus on improving Tier 1 Core instruction?
NO. Improving Tier 1 core instruction will NOT be the only thing you need to improve, but it would be a priority as improving core instruction will reach the most students and prevention of learning challenges is a key tenet of MTSS. For the kids who have fallen behind and Tier 1 core instruction alone is not helping them to close the gap, you will still want to focus on improving Tier 2 and Tier 3 supports. This is where measuring adequate progress truly comes into play. As stated earlier, adequate progress represents growth from a category of higher risk to a category of lesser risk (or remaining at low risk) between two consecutive assessment periods. For those students that are behind and below grade level expectations, this type of growth may not be feasible. Fortunately, additional research has been completed on schools across the nation to determine what percentage of students we can expect to make adequate progress based on their initial assessment risk level and the grade level they are in. The NDMTSS trainings and coaching continues to support ND school-based teams to untangle these and other data-based decisions.
Written By: Chris Thompson, SEEC/NDMTSS Data Specialist